The Explainer
Why does a multifamily cash flow less than the analysis said?
Fernando, founder of Senjo · 6 min read
TL;DR
Cash flow is what is left after every bill and the mortgage. The gap between projected and actual is mostly expenses the listing never showed. Those expenses grow with the building's age. A sound starting point: 40 percent of collected rent for buildings from 2000 or later, 45 percent for 1980 to 1999, 50 percent before 1980. Because cash flow is a thin slice at the bottom, a small expense miss becomes a huge cash flow miss. On one illustrative 8-unit, cash flow fell from 1,385 dollars a month to 126. The check takes two minutes: compare your projected expense ratio to the one for the building's age. If yours is lower, that difference is coming out of your cash flow.
Why does a rental cash flow less than the analysis said?
Because the analysis used the listing's expenses, not the ones you will actually pay. The rent is usually close to what the listing said. The bills are not.
Two terms carry the rest of this article.
Cash flow is what is left each month after you collect the rent, pay every bill to run the building, and pay the mortgage.
The expense ratio is the share of collected rent that goes to running the building: taxes, insurance, repairs, water, management, and savings for big replacements. Not the mortgage. Collect 10,000 dollars a month, spend 4,000 running the building, and your expense ratio is 40 percent. We cover how to rebuild it from a listing in what a good operating expense ratio looks like.
The bills that go missing are the ones the seller's way of owning made invisible. Management at zero because the seller does it. Property taxes on an old assessment that resets when you buy. Rules vary by state and county, so confirm yours. No reserves, the savings for the roof and the boiler. And no other and admin line at all: bookkeeping, licenses, advertising a vacancy, and the cleaning when a tenant moves out. We go through each of those line by line in what most people miss when they underwrite a small multifamily. This article is about what that miss does once you own the building.
Why does a small expense miss wipe out so much cash flow?
Because cash flow is the last, smallest slice of the money, and every missed expense dollar comes straight out of it. The mortgage does not shrink when expenses rise.
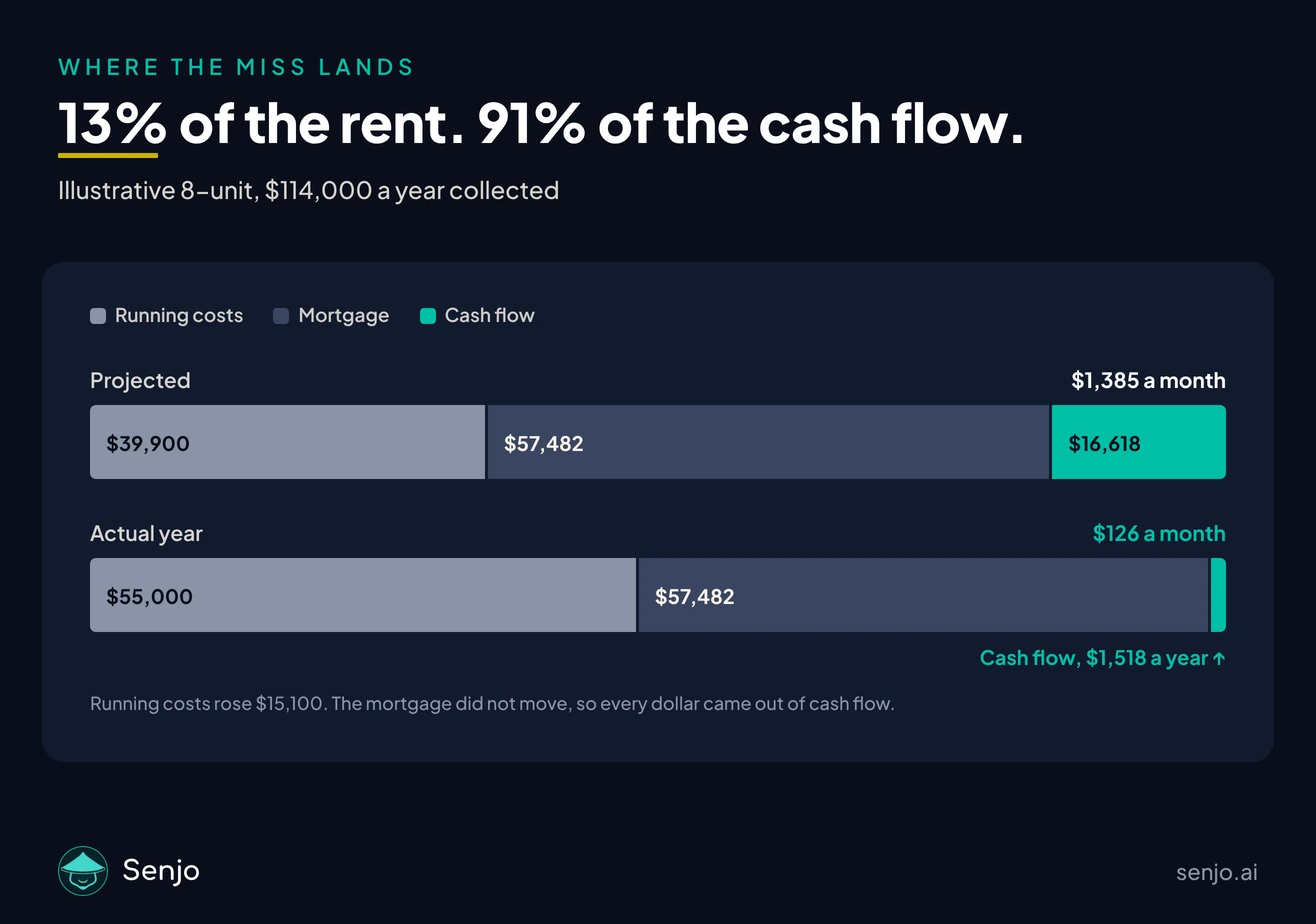
On the illustrative 8-unit below, the building collects 114,000 dollars a year. The projection put running costs at 39,900 dollars and the mortgage costs 57,482, leaving 16,618 dollars a year of cash flow.
Then running costs come in 15,100 dollars higher. That is about 13 percent of the rent, which does not sound dramatic. It is 91 percent of the cash flow.
The projection was not wildly wrong. It was a little wrong, in the one place where a little wrong is everything.
How does the age of the building change the expense ratio?
Older buildings cost more to run, so more of the rent goes to running them. Older roofs, pipes, and boilers break more often, cost more to fix, and need replacing sooner.
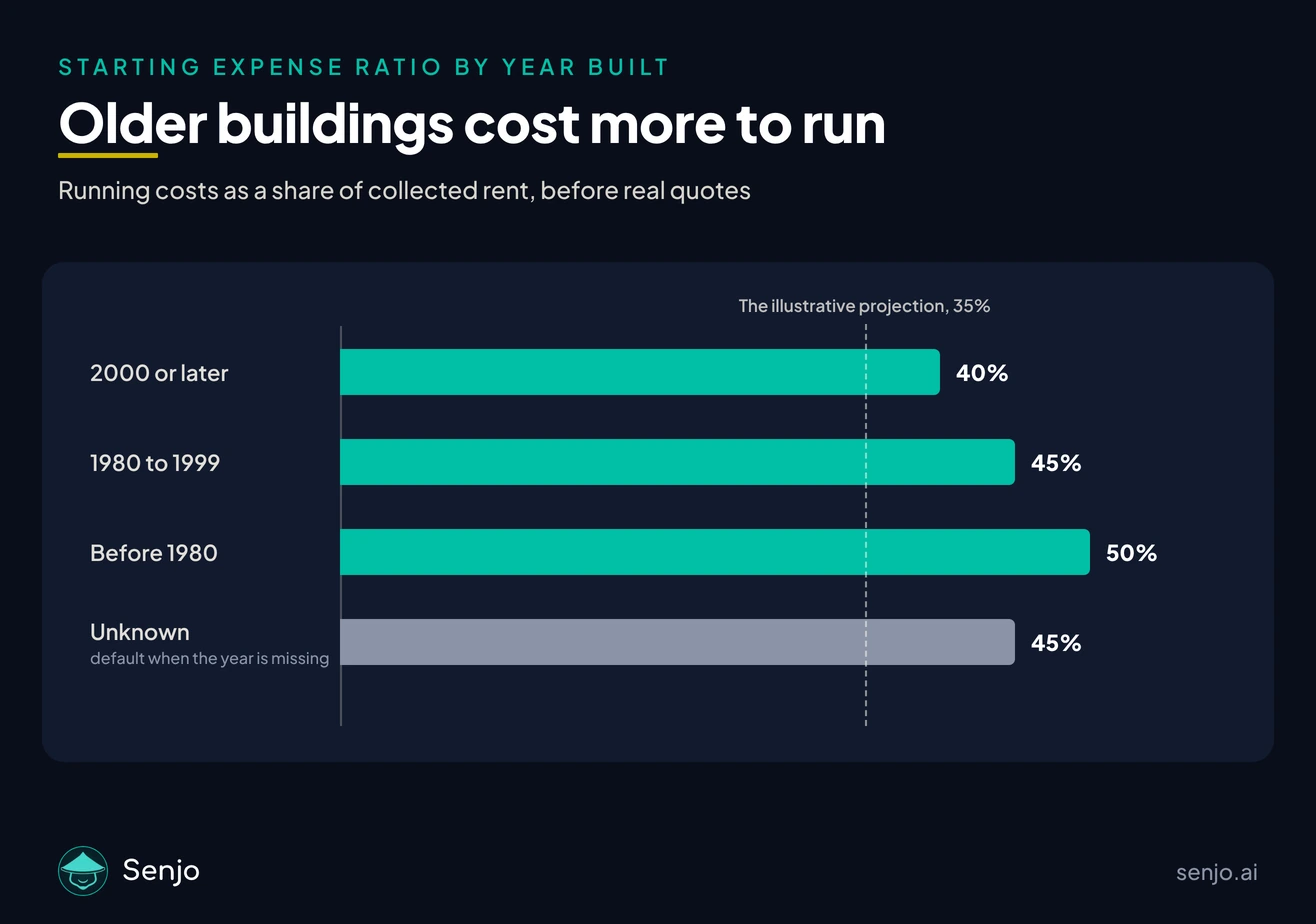
A starting expense ratio by year built, as a share of collected rent:
2000 or later: 40 percent.
1980 to 1999: 45 percent.
Before 1980: 50 percent.
Year built unknown: 45 percent.
These are starting points, not answers. Who pays the utilities, the climate, and the building's condition all move the number. But a projection that uses one expense ratio for every building will be wrong by more on older ones, and many first multifamily buildings a new investor can afford are older ones.
What does the gap look like on a real set of numbers?
On this illustrative 8-unit, projected cash flow was 1,385 dollars a month and the actual came in at 126. Same rent, same mortgage. Only the expenses changed.
The deal (illustrative). An 8-unit built in 1972, bought for 960,000 dollars. Eight units at 1,250 dollars a month, less 5 percent for empty units and unpaid rent, leaves 114,000 dollars a year collected. The loan is 720,000 dollars at 7 percent over 30 years, or 57,482 dollars a year. All figures are illustrative.
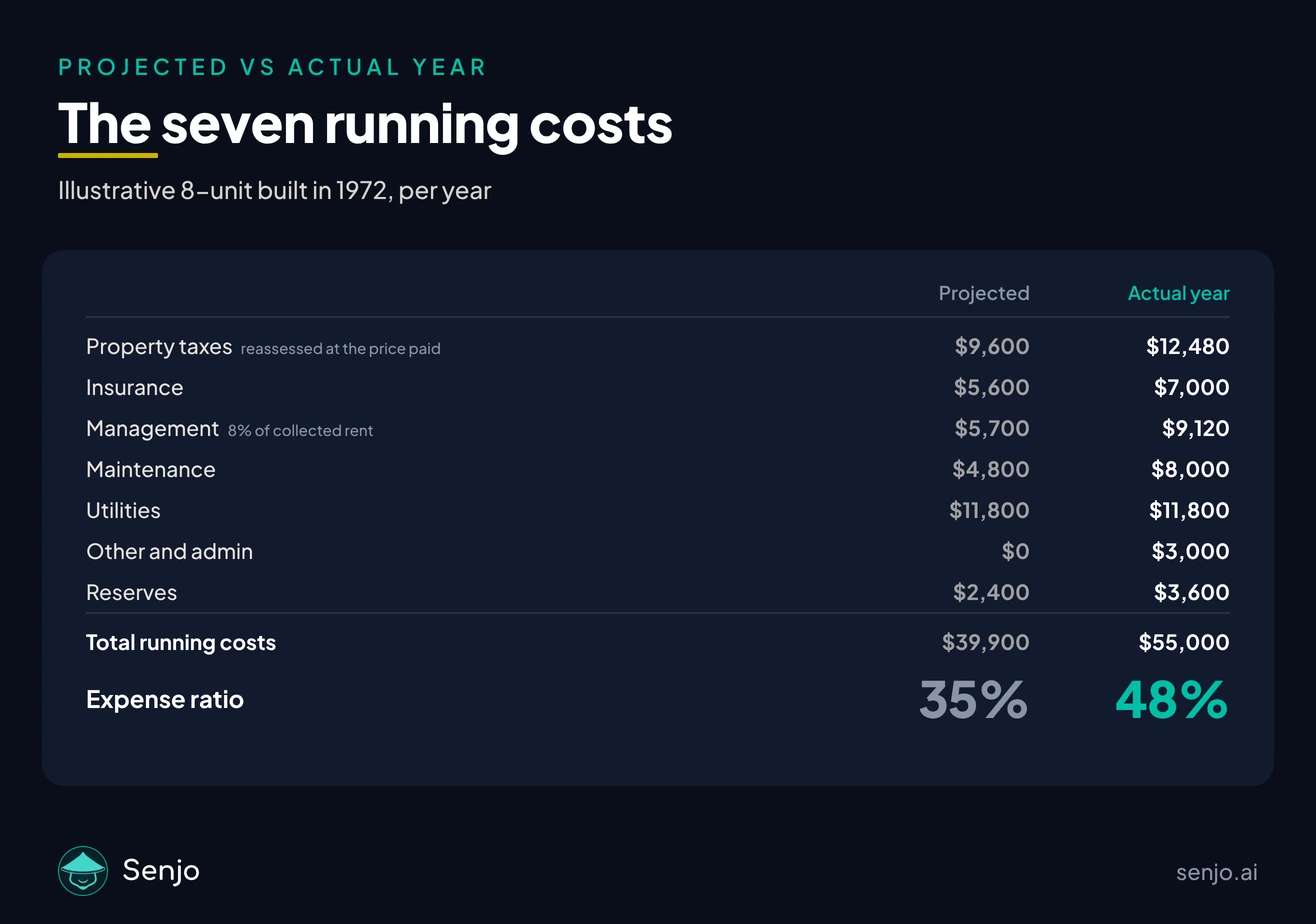
Running costs were projected at 39,900 dollars, a 35 percent expense ratio. The actual year came in at 55,000, or 48 percent. Yearly profit before the mortgage, which investors call net operating income or NOI, fell from 74,100 dollars to 59,000, a drop of 20 percent. Cash flow fell 91 percent. The return on the 240,000 dollar down payment went from about 6.9 percent to about 0.6 percent.
No single line broke it. Other and admin went from nothing to 3,000 dollars, but the rest was the projection running a little low on almost every line, and the 1972 building made each of those lines more expensive. The actual year landed at 48 percent, right next to the 50 percent starting point for a building that age.
Same deal, newer building. Run it on a building from 2008 at its 40 percent starting point. Cash flow comes in near 910 dollars a month. Still under the projection, but by about a third, not by nine-tenths.
When does the gap show up?
Usually not in the first few months, which is what makes it dangerous. The seller's recent repairs are still holding, the long-term tenants are still in place, and the reassessed tax bill may not have arrived yet.
Then it comes in pieces: the first move-out and the cleaning and advertising that come with it, the new tax bill, the first insurance renewal at today's prices, and the first big repair. Judge the deal on its first three months and you are judging it before most of the costs have shown up.
How do you check your own projection before you buy?
Compare your projected expense ratio to the starting ratio for the building's age, and treat the difference as missing cost.
1. Find your ratio. Add up every running cost in your projection, not the mortgage, and divide by the rent you expect to collect.
2. Find the building's ratio. Check the year it was built against the starting points above. For a 1972 building, start at 50 percent.
3. Take the difference out of cash flow. Projected at 35 percent on a building that starts at 50 is 15 points short. On the illustrative 8-unit, that is 17,100 dollars a year, more than the entire projected cash flow.
If what is left still meets your bar, the deal may still work. If it does not, you found out before closing instead of in year two. Then replace the estimates with real quotes.
This is the read Senjo runs on a deal. It sets the starting expense ratio from the year built, breaks it into seven lines (property taxes, insurance, management, maintenance, utilities, other and admin, and reserves) so you can see where the money goes each month, and reassesses the property tax at your offer price instead of the seller's old bill.
Worked example, illustrative
| Rent collected, per year | $114,000 |
| Running costs, projected | $39,900 (35%) |
| Running costs, actual year | $55,000 (48%) |
| NOI, projected to actual | $74,100 to $59,000 |
| Mortgage, per year | $57,482 |
| Cash flow per month, projected to actual | $1,385 to $126 |
| Return on $240,000 down | 6.9% to 0.6% |
| Same deal, 2008 building at 40% | about $910 a month |
Illustrative 8-unit built in 1972, bought for $960,000. Eight units at $1,250 a month, 5 percent vacancy and credit loss. Loan of $720,000 at 7 percent over 30 years. Only the running costs differ between the two columns. Property tax reassessment rules vary by state and county. Get real quotes before you trust any of it.
Frequently asked
Why is my actual rental cash flow lower than projected?
Usually because the projection used the listing's expenses instead of yours. Management, reassessed property taxes, reserves for big replacements, the other and admin costs of running a building, and insurance at today's prices are the common misses. Tax reassessment rules vary by state and county, so confirm yours. Because cash flow is a small slice after the mortgage, a modest expense miss can erase most of it.
What expense ratio should I use for an older building?
Start from the year it was built: 50 percent of collected rent for a building from before 1980, 45 percent for 1980 to 1999, and 45 percent if you do not know. A building from 2000 or later can start at 40. Then replace the estimate with real quotes as you get them.
Is a 35 percent expense ratio realistic on an older building?
Rarely. On a building from before 1980, 35 percent usually means something is missing, most often management, replacement savings, or the reassessed tax bill. Treat a low number on an old building as a question to answer before you buy.
Should I include management if I plan to manage the building myself?
Yes. Price it, then decide whether you want the work. If the deal only cash flows because you work for free, the building is paying you a wage, not a return.
Senjo is an AI sensei for solo multifamily investors. Fernando, its founder, owns two single family rentals and is working toward his first small multifamily deal, building the tool he needed when he got stuck between the two.